NJIT Math 222
Fourth MATLAB Assignment
Computational project part 1
I ran the code with $N=10000$, $\gamma=1$ and $\beta$ varying. The assignment says to expect different behavior depending on whether or not $R_0>1$, where $R_0 = \frac{\beta N}{\gamma}$.
For these values of $N$ and $\gamma$, this an epidemic when $\beta> 10^{-4}$. Therefore I tried three values of $\beta$: $2\times 10^{-4}$, $1.25\times 10^{-4}$, and $9\times10^{-5}$. For the first two values, I saw growth, with a larger epidemic in the first case $\beta= 2\times10^{-4}$.
My results are in a
MATLAB-generated webpage . This was generated from
Computational project part 2
Here you were asked to use phase-plane drawing software to examine solutions graphically. It was pointed out that $\frac{dI}{dt}=0$ when $S^* = \frac{\gamma}{\beta}$. From the following three images, we see that $S_0> S^*$ when $\beta>10^{-4}$, which is when we see epidemics.
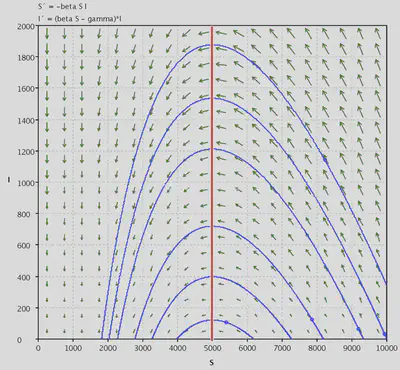
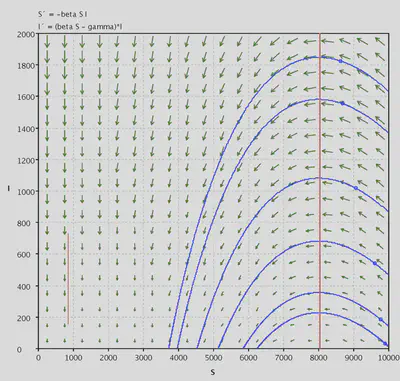
In the third case, $\beta=9\times10^{-5}$ $S_0=11111>N=10000$, so the infection number is decreasing at $t=0$.
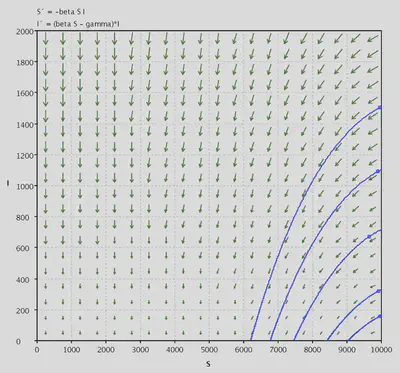
There is also a question asked “Can this model support a sustained epidemic.” The answer is that it cannot. In a sustained epidemic, the infection rate $I(t)$ would have to reach a nonzero steady state but the phase plane shows that $\lim_{t\to\infty}I(t)=0$ for all solutions, so it can’t sustain an epidemic. To support a sustained epidemic, a model must refresh its supply of susceptible individuals. Fortunately for the germs, we do that anyway by having babies! A more complete models will include births.